
Product · All numbers
Every number your ad platforms send, in one table
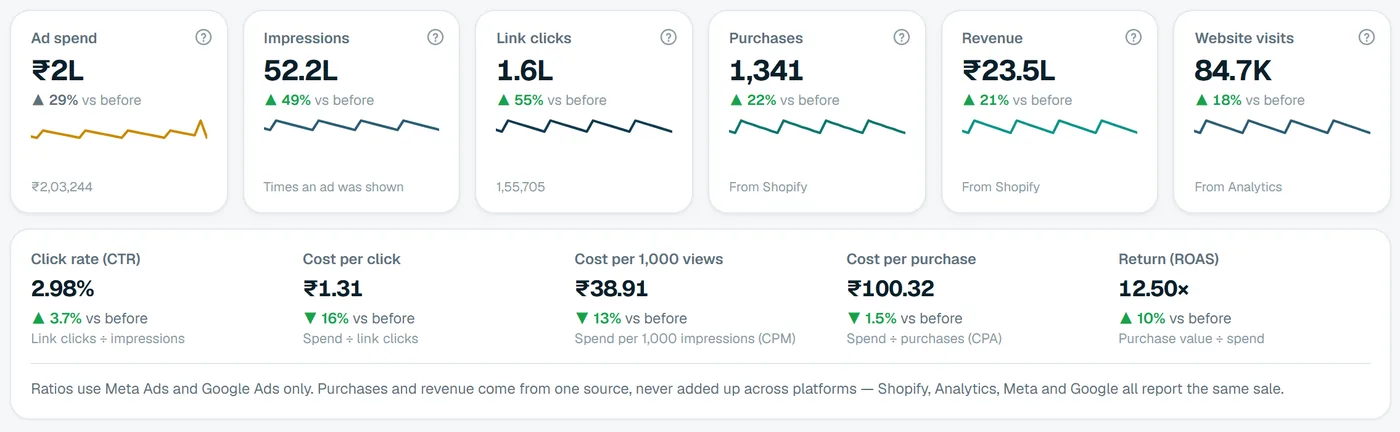
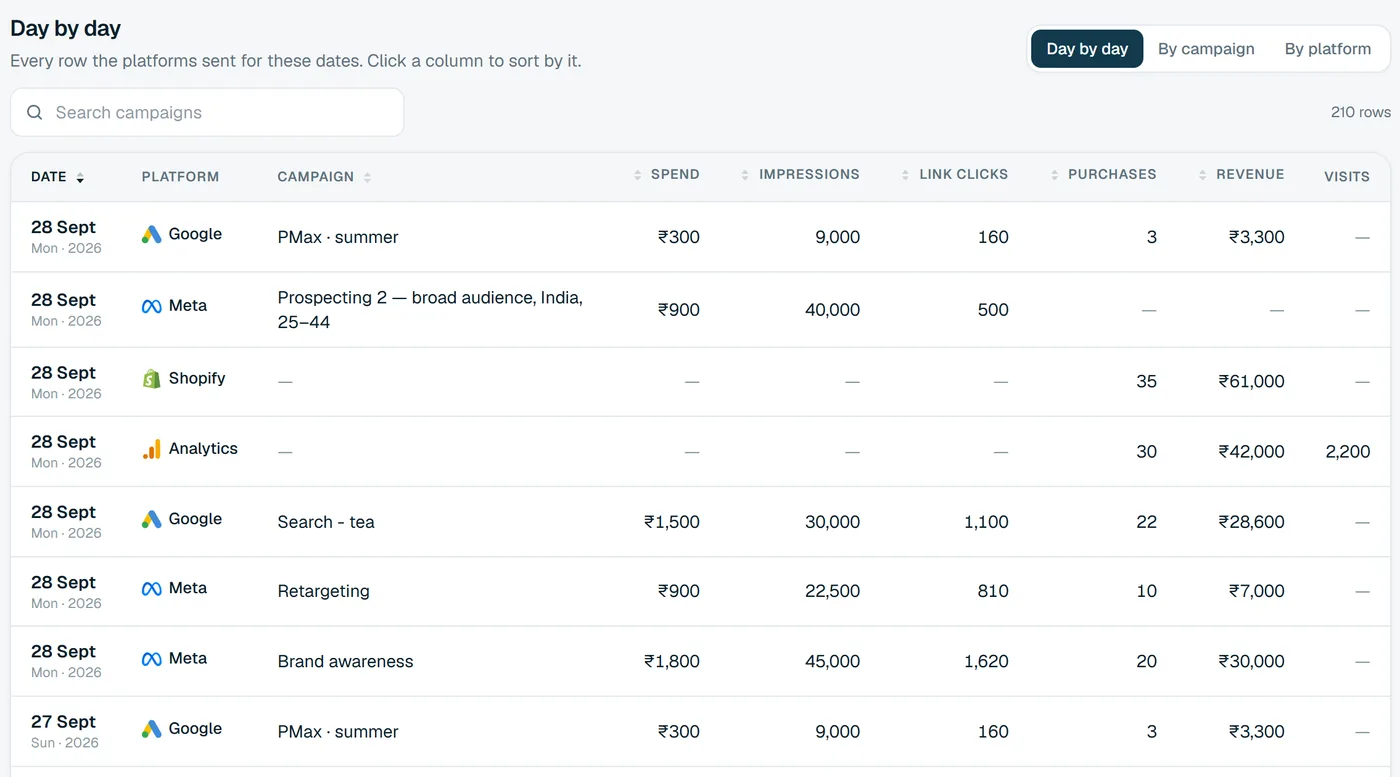
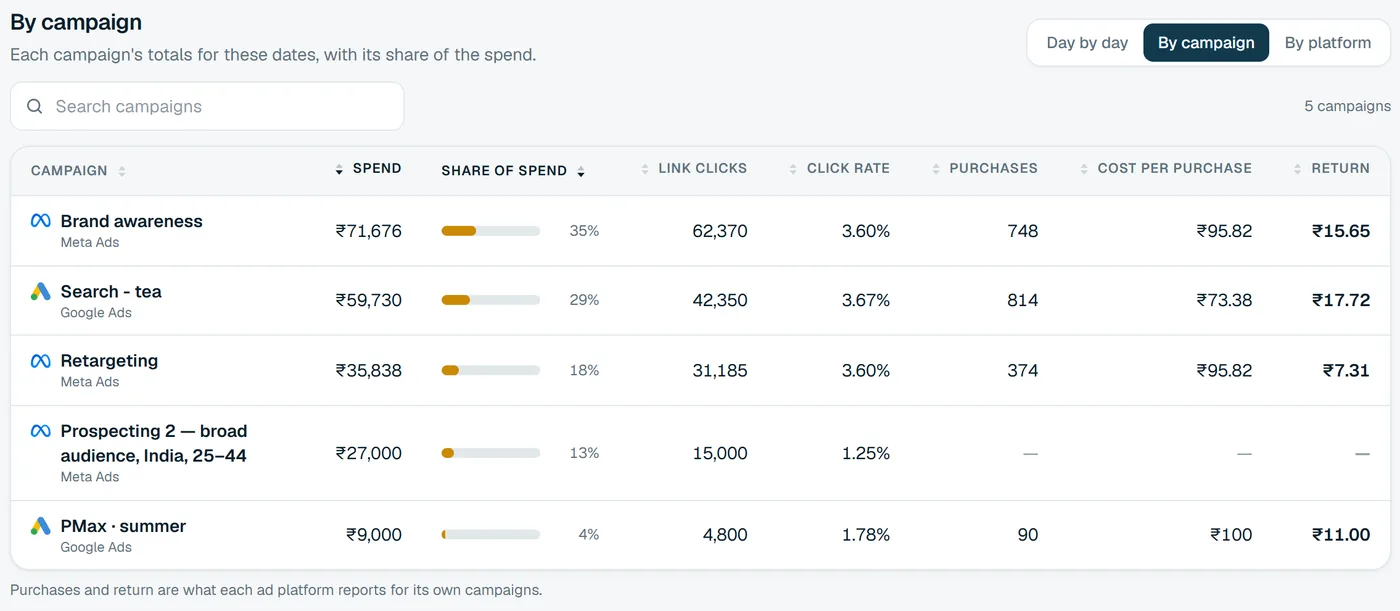
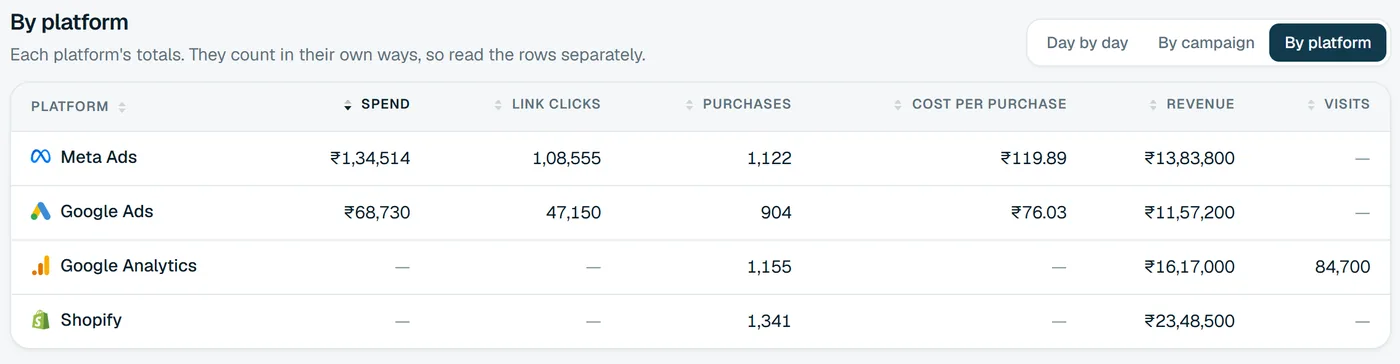
Spend, impressions, link clicks, purchases, revenue and visits from Meta Ads, Google Ads, Google Analytics 4 and Shopify, for any dates. Read it day by day, by campaign or by platform, with the ratios already worked out.
Filters
Any dates, any platform, compared with anything
Choose the days and the platform once; the totals, ratios and tables below all follow. Dates are in your organization's timezone, and today is marked as still coming in.
- Yesterday, 7 days, 30 days, this month, last month, or your own From and To.
- All platforms at once, or just Meta Ads, Google Ads, Analytics or Shopify.
- Compared with the previous period or the same days last year.

Three views
Day by day, by campaign, or by platform
The same numbers, cut three ways. Switch below to see each one.
Ratios, worked out
No more spreadsheet formulas
Each ratio is calculated from the totals for the dates you picked, not averaged from daily figures, so it matches what the platforms show for the same range.
Ad ratios use Meta Ads and Google Ads. Pick Shopify or Analytics as the platform to see theirs.
| Ratio | How | Better when |
|---|---|---|
| Click rate CTR | Link clicks ÷ impressions | Higher |
| Cost per click CPC | Spend ÷ link clicks | Lower |
| Cost per 1,000 views CPM | Spend per 1,000 impressions | Lower |
| Cost per purchase CPA | Spend ÷ purchases | Lower |
| Return ROAS | Purchase value ÷ spend | Higher |
| Average order AOV | Revenue ÷ orders (Shopify) | Higher |
| Visits that bought CVR | Purchases ÷ sessions (Analytics) | Higher |
| Revenue per visit RPV | Revenue ÷ sessions (Analytics) | Higher |
Honest totals
One sale is counted once
A customer who clicked a Meta ad and then a Google ad is claimed by both. Add the two platforms up and your sales look bigger than they were. Moatrics never does.
- Revenue and orders come from your store, or Google Analytics if there's no store.
- Meta's and Google's purchases stay on their own rows, never added together.
- Each total says where it came from: “From Shopify”, “From Analytics”.
Questions
About All numbers

Bring your brands into one dashboard
Moatrics is in early access for brands and agencies. Tell us how many brands you run and which platforms you use, and we'll set you up.